Featured Products
Behind the Scenes with Light and Color
Introduction
Light and Spectrum is a common topic among all of the sciences. You will find a chapter devoted to it in Astronomy, Chemistry, Physics, and Biology. Therefore, enhancing your ability to teach this topic is going to benefit every member of the science department.
The RSpec-Explorer empowers teachers to have their entire class to experience quantitative spectroscopy at the same time and in a meaningful way. Up until now, it was very difficult to manage to get more than one person to be sure they were seeing the same thing through a diffraction grating or a refraction table. But with the RSpec-Explorer you can easily point out features in a gas tube line spectrum, a sodium lamp, or anything you can think of. In this article, I provide 10 examples of experiments you can do on light and spectrum, all of which are made easier by using the RSpec-Explorer.
1. Experiments on Color
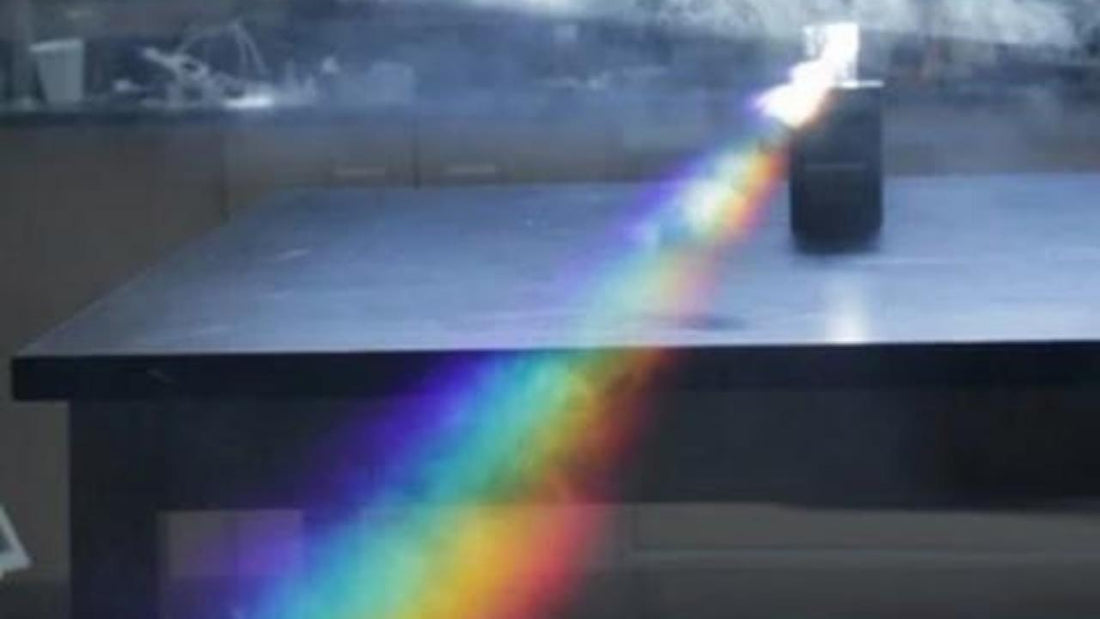
One of the first experiments you should do is to demonstrate that white light is made of colors. The term "white" is often used by scientists to refer to a light source that emits or reflects all visible wavelengths (400-700nm). However, the human eye cannot distinguish this real white light from a light source that is made of only a few colors. For example, if you examine a cell phone flashlight feature through a diffraction grating (such as the one on the RSpec Explorer's camera) it will reveal that this apparently "white" light is actually missing some of the deep blues. Also, if you look at a "white" fluorescent lamp tube, it will reveal that it is made of several distinct colors but not a broad spectrum (like say for example a sunbeam, or a white incandescent lamp).
The white light of the iPhone flashlight turns out to be deficient in the light blues. Unlike the even spread of color that would come from sunlight.
If you have a color mixing device (three colored lamps would work, or three lamps with filters) you can demonstrate to yourself that "white" light can be created by mixing Red, Green, and Blue (RGB). This is how a cell phone screen makes white light, and a computer screen, and most projectors! There are many sources available for this experiment.
Magenta being faked by mixing red and blue. The spectrum on the right reveals the peaks of these two colors: 425 and 610nm.
A better trick is to mix just two colors and get a new color that will completely fool the eye. A major example is to mix red and green light and make "yellow." I put the quotes here again because it only appears yellow – there is nothing yellow about green and red light mixed, except that it can fool the eye by appearing to be yellow. Mixing red and blue light makes "magenta" light and mixing blue and green makes "cyan" (again the quotes describe the appearance not the reality of the light).
The advantage of analysis through a diffraction grating is that it can easily discern the two colors, which diffract differently. The spread or "dispersion" of the light is linearly-dependent on its wavelength (to a good approximation). That's how we can separate the light by its wavelength and reveal whether we are looking at a true color or only a synthesized one.
2. Ionized Gases
Ionizing Gases to display their spectra is an important activity in most science classes. Of course, you want to point out that different gases have different spectra and these can be used for identification. Every noble gas was identified first based on its spectrum. (How else could you tell Neon from Argon, seeing as how they are both chemically inert?!!)
Gas tubes discharging: Hydrogen, Helium, Neon, Mercury.
The most important example is hydrogen, which is not a noble gas, but which has a readily recognizable spectrum. The Balmer Series (n=2) is the visible portion of the spectrum. It has a very obvious and bright cyan (486nm) colored line, a somewhat less bright red line (656nm), and a few violet lines (434nm, 410nm). Invisible is the Lyman (ultraviolet, n=1) and the Paschen (infrared, n=3) series. The hydrogen spectrum is important, not just because it is so familiar, but because it can be calculated easily (using the Rydberg formula below), and it was also the spectrum that was used by Niels Bohr when he applied quantum theory to explain atomic spectra for the first time.
The Balmer series for hydrogen contains the four visible lines of hydrogen's spectrum and all of these transitions involve the n=2 orbital (marked in yellow).
The four characteristic spectral lines in the Balmer series for Hydrogen.
Helium, on the other hand, is not as familiar but can be made so by learning to recognize it by its bright yellow (589nm) line. Also, the story that the helium absorption lines were first seen in a solar eclipse is a good history of science tidbit. That is how helium got its name, from the sun god – Helios. Also, helium looks yellow-pink when ionized, where hydrogen usually looks red-purple.
Recognize Helium based on its bright yellow discharge line and its pale yellow spectral tube.
Neon is amazing to look at even without a diffraction grating. Its pastel-electric red glow earned it its name as the "new" element for the electric age. The diffraction grating reveals that it is saturated with reds, yellows, and a few scattered greens.
In the plasma globe you can find ionized gases and with the RSpec-Explorer and (if you can line it up carefully) you can identify the gases inside (helium is the main one).
It is also possible to burn salts and reveal the spectral lines. The most obvious salt is table salt, sodium chloride, which burns well in a paper clip loop held over a candle flame. Teachers often dissolve a lot of salt in a little water which can sometimes help (dissolved ions have more surface area/volume than crystals so they burn easier). The yellow sodium "doublet" (two very close wavelengths at once) easily identifies it. You can also recognize sodium in yellow streetlights at night. Other salts that emit good colors will contain copper, strontium, calcium, potassium, and iron. Which you can usually find in the chemistry storeroom. All of these are often used in fireworks (usually mixed with magnesium and gunpowder) and if you need help getting the fire hot enough, you should try dissolving them in methanol. Safety first! Be sure to have safe water on deck for emergencies and a fire extinguisher is a good idea, too.
A paper clip bent to include a small loop does a great job of carrying salt to the flame.
3. Investigate Different Light Bulbs
These days people are very interested in how all the different types of light bulbs make light. Diffraction is the best way to identify how the light is made. If you look at an ordinary incandescent bulb you will see it has a broad spectrum with a lot of yellows and reds giving it a "warm" glow. On the other hand, fluorescence light bulbs contain mercury and will have several easily recognizable spectral lines that correspond to that element. Mercury is a good choice for fluorescence because the many energetic purples and UVs in the spectrum can give energy to fluorescent paints which reradiate that energy as visible light. If anyone doubts that there is mercury in our light sources, they should be easily convinced by this demonstration!
A mercury discharge tube demonstrates several violets and greens.
Compared to incandescent bulbs, fluorescent bulbs tend to make people look drained of color. This is because the high amount of blues and purples can cast an "unhealthy" purple glow on you. A 100W incandescent bulb nearly imitates the sun's spectrum. Which peaks in yellow-green, giving you that healthy glow.
A fluorescent light bulb shows many of the same spectral lines as mercury.
You can also investigate other light sources such as white diodes (which have a lot of purples because they fluoresce, too), yellow sodium parking lot lights, or even a plant light. Plant lights aim to provide the two spectral colors of photosynthesis – blue and red. Green plants reflect green light and thus they do not absorb it for making glucose. Red light also provides a signal to the plant to let it know that the day is long enough (i.e. spring or summer) to start investing itself in growth. (Some plants actually suppress their growth in summer to take advantage of a less competitive winter season.) Anyways, plant lights provide these non-green colors in high supply.
An incandescent bulb reveals its warm colors by peaking in the reds and yellows.
4. Analyze the Wavelengths of Lasers and Diodes
Light Emitting Diodes are a ubiquitous source of light in our lives. In most cases, diodes will be sold to emit a specific wavelength of light but in actuality, there will be a spread of color about this "nominal" value. (Nominal is an engineering term meaning "named" or expected, as opposed to what actually results during the experiment.) For example, a "626nm" LED might emit 96% of its light between 610 and 632nm. This amount of spread can be measured by the RSpec-Explorer and it's interesting to compare this with laser light.
The orange diode demonstrates that its wavelength is quite spread out over the 30nm that surrounds its nominal value.
Lasers have "monochromatic" light. This means that it is very nearly only one specific wavelength. These wavelengths are usually listed on the laser itself. A good experiment would be to verify that the wavelength printed on the laser is actually the wavelength it emits. Even diode lasers are usually quite monochromatic. "Lasing" requires the light to be nearly one wavelength – lasers are a good example of light standing waves.
A HeNe laser demonstrates both that it is monochromatic and that it contains neon by emitting the 626nm red that helium lacks.
When it comes to red lasers there are many different types. Helium-Neon lasers will have different wavelengths than red diode lasers. You can use the RSpec-Explorer to prove that it is actually neon that emits the red light in the helium-neon laser. This is a good demonstration of the power of spectral analysis to identify elements. If you have a bare helium-neon laser it can be particularly engaging in this activity.
A bare helium-neon laser glows yellow pink but emits a neon red beam.
5. Investigate Fluorescence
Fluorescence is always an engaging activity. Energetic light (such as UV or violet) lands on a substance that can absorb it and that energy is re-emitted as less energetic visible light. For example, a black (UV) light might shine on your socks (which have fluorescent detergent) in them and then white visible light will be emitted.
Good candidates for investigation with the RSpec-Explorer include tonic water, highlighters, extra virgin olive oil, Willemite, and phosphorescent vinyl sheets. All of these will glow under UV or violet light (such as a violet laser or black light) but the olive oil works better with a green laser (the yellow olive oil absorbs violet light very quickly).
A violet laser energizes the quinine in tonic water.
Phosphorescence is a special type of fluorescence in which the emission of the light is suppressed for an extended period of time (the atomic transition is slower). In fluorescence, the emission of light is nearly instantaneous. In either case, the wavelength of the emitted light is always longer – less energetic. The words phosphorescence and fluorescence are only historical. Not all phosphorescent materials contain phosphates (though most do) and not all fluorescent materials contain fluorides (though many do, including toothpaste). Willemite, which is a fantastic glow rock, contains neither phosphorus nor fluorine.
A few fluorescent rocks with UV turned on. Willemite is in the middle.
6. Measure Temperature Using the Blackbody Curve
Turn on your electric oven, toaster, or electric stove and it will first glow red-hot, then yellow-hot, and if we went further it would glow white-hot. This change in color with temperature was described mathematically by Lord Rayleigh, James Jeans, Wilhelm Wein, and finally Max Planck. The Rayleigh-Jeans Law described the long wavelengths and Wein's Law described the short wavelengths, but both "laws" failed outside of those conditions. Planck was the first to solve the emission problem for ends of the curve. Planck's function is also called the "blackbody" curve because even a black object will be seen to emit light in these proportions if it gets hot enough.
The Reference Library includes Planck Curves which can be used to fit to our spectrum.
We can use this curve to determine how hot our light bulbs are. The problem is that most of the light they emit is infrared which is generally not visible. If you are willing to accept that there is an enormous amount of invisible light, then you will be able to approximate the temperature of a glowing hot object by this method. You may be surprised to find out that even little circuit-lab style bulbs are actually heating up to about 4000K – but this is consistent with theory.
I am not saying that you can get a highly accurate measurement with the RSpec-Explorer camera, but you can approximate the temperature reading, and probably within 15% (be sure to turn the brightness down in the settings). It is impressive that lightbulbs get this hot to glow. It also helps us appreciate why they must be contained in bulbs – if they were exposed to the oxygen in the air at these temperatures they would immediately burn up and break the circuit.
It's fun to compare these light bulb filaments to the temperature of the sun which is a G2V star (there is a star reference collection in the References, too). The temperature of the sun can be determined from the black body curve as well. In fact, this is how we measure the temperature of the sun – at least on its surface!
Measuring temperature using the blackbody curve is a good way to get Modern Physics concepts into your classroom.
7. Diffraction Experiments
In Astronomy and Physics, the idea of Diffraction is a commonly taught subject. Diffraction of light is one means by which we can separate it based on its wavelength. A diffraction grating is made when a laser cuts tiny grooves into the surface of a piece of plastic or glass. A good example of one is a CD.
Some themes of diffraction are that the smaller the distance d between the grooves, the more dispersion, X, you will get. The light will spread apart further from its straight line path. Also, the longer the wavelength, λ, of the light the more easily you can disperse it. And of course, the more space it has to travel before it lands on a screen the more it will disperse. This length is usually called L (the distance to the screen or camera). All of these ideas come together in the diffraction formula:
Xm = m λ L / d
where m is an integer, usually 1, that tells you the "order number." We need m because the pattern will repeat itself about twice as far out, and that is called the 2nd order. Usually, the 2nd order is much less bright than 1st order diffraction. This formula is an approximation, assuming that the light is not being diffracted at large angles from the straight-ahead path, it works well for angles under 30 degrees (ie first order).
You'll have to measure both the dispersion X (left) and the distance to the camera L (right) if you wish to apply the diffraction formula. The wavelength λ is given in this case, which is unusually convenient. What is not given is the groove spacing d.
A good lab would be to use this formula to try to measure the line spacing "d" for the diffraction grating of the RSpec-Explorer camera. The units should be in meters/groove or meters/line. Use meters as the unit for X, λ, and L.
8. Measure the Wavelength of Infrared
The wavelength of Invisible Infrared Light can be measured with a diffraction grating and a digital camera (which can see the infrared light). But, the RSpec-Explorer makes this easier because it can tell you the wavelength based on the distance the light is diffracted on the video screen. A TV remote control can provide a source of near-infrared light (should be between 800 and 1000nm) but I have had more success with loose infrared diodes because I can crank up the voltage and get them to shine very bright. To ensure success, have a very dark room with the diode close to the camera. Also, when you rotate the camera you should be able to see the first order diffraction of the infrared light.
An infrared diode (bright circle) and its lens flare (dimmer circles) are plainly visible in this screen capture. Lens flares occur when bright lights are improperly focused by lenses.
To perform this experiment, get your diode showing up very bright, and line it up on the yellow calibration line. You will not be able to see the diffracted light because it will be diffracted so far that it will not appear on the screen. So instead we will have to recalibrate the camera to see further than the visible spectrum. First, line up a second light source with a familiar visible spectrum such as a Hydrogen gas tube or a white diode. Then, once you have it on the yellow line, rotate the camera to the right. This should cause the two light sources to be off-camera to the left but the color spectrum will remain. Based on your knowledge of that familiar spectrum you can recalibrate the camera. Go to Tools à Calibrate à Linear. Click on the first familiar pixel and enter its wavelength (in the case of hydrogen this would be the 486nm cyan line). Then click on the second pixel and set that to another wavelength (in the case of hydrogen this would be the 656nm red line). Now "apply" that calibration and close the window. Turn off your familiar light source and the infrared light should now be visible around 900nm. Be sure to move the yellow bars to sample it and explore its peak brightness. Like all diodes, infrared ones have a significant spread.
A screen capture taken after recalibrating the camera to explore the infrared. The hydrogen spectrum was used as a familiar reference. The next step would be to double check that the infrared diode was lined up with the hydrogen tube at the origin, and then turn off the hydrogen tube to reduce accidental light contamination.
9. Experiments that use the Intensity Feature
You probably have already noticed that brighter spectral lines show up as higher peaks on the y-axis. This is particularly obvious with the hydrogen spectrum's cyan line at 486nm which is much brighter than its red 656nm line. This intensity reading feature can be helpful in other experiments as well. To take advantage of this feature, be sure to turn off the "Auto-Scale Y-Axis" feature on the bottom right panel of the screen.
A good experiment to try out is to block a light source with two polarizing sheets. When the polarizers are rotated they block more of the incoming light. As the relative angle increases (to 90 degrees) the blocked light source dims to nearly zero transmittance. This reduction in brightness is supposedly dependent on the square of the cosine of the relative angle between the polarizers. This intensity function I(θ) = Imax cos2(θ) is known as Malus' Law. It is helpful if the source of light is monochromatic.
Crossing Polarizers can reduce the Intensity of the light that comes through.
Another experiment that you can try (one that probably belongs in a Chemistry class) is that a higher concentration (molarity) of dye will block a proportionately larger amount of light. This is known as Beer's Law. It might be best to start with a clear water sample for calibration then slowly add dye. I have had a lot of success with Coca-Cola. Again, it is helpful if the source of light is monochromatic.
In this Beer's Law Experiment, the concentration of the solution is increased, causing the intensity of light to be decreased. Moussing over the central plateau makes an intensity measurement. It is important to set a constant scale for the y-axis. I have chosen not to fill the graph with color because the wavelength of light is not being measured, only brightness.
10. Astronomy Experiments
The RSpec software that is employed with the Explorer camera was originally produced to serve astronomers. Thus, there are many vestigial traces of this in the reference libraries and in the training videos that accompany the device. It can be fun to take advantage of these features and see how far one can push the camera.
You can view the solar spectrum by reflecting sunlight from along the length of a needle at the camera. Since all that is required is to view it is a bright source of light lined up along the yellow 0 nm line, it is quite possible to take advantage of this and observe the sun. Most visible in the spectrum will be the g2v black body curve and, if you zoom in, the Fraunhofer Absorption lines.
Here the reference library is used to investigate a g2v star. This is the same type of star as the sun. The next move would be to click Planck and check that 5700K is the right temperature for this curve.
Perhaps an easier demonstration is to view the clear, blue sky through a slit. This reveals that the blue sky is actually a mixture of all colors with more blue than any other color. The truth is that there is actually a little more violent than the camera can reveal but like the human eye the camera is less sensitive to violet than to blue. This "unsaturated blue" (meaning blue + white) is consistent with the Rayleigh Scattering Model for why the sky is blue.
If you own a telescope you may be able to analyze the spectrum of the stars with the RSpec-Explorer. Because of the sensitivity limitations of the camera, it is not possible to observe stars without a telescope. But, a telescope can help a lot. Be sure to know which star you are looking at (I recommend Sirius, Betelgeuse, and Vega), then look up what type of star they are (a1v, m2i, a0v respectively).
Conclusion
Experiments on light can be very engaging, but they can also be very confusing. It is important that we take steps to ensure that our students are able to view what they are supposed to be seeing, and recognizing what is being pointed out. The RSpec-Explorer projected overhead for your students' benefit is probably the best way to in engaging your students in spectroscopy (especially if used in conjunction with hand-held spectrum analyzing devices). I have found that students are very interested in cameras and how they can see things that our eyes cannot. If building a community of learners in your science classroom is your goal then you should add this device to your collection of lab equipment.
Old-fashioned – but not obsolete – spectrum analyzing equipment.
James Lincoln
Tarbut V' Torah High School
Irvine, CA, USA
James Lincoln teaches Physics in Southern California and has won several science video contests and worked on various projects in the past few years. James has consulted on TV's "The Big Bang Theory" and WebTV's "This vs. That" and the UCLA Physics Video Project.
Contact: James@PhysicsVideos.net


