Featured Products
INTRODUCTION
In order for students to solve energy conservation problems, they need to be proficient with both qualitative and quantitative tools. Before jumping to equations, students first need to be able to identify where the energy is being stored before and after a certain event. Some qualitative tools which help students represent where energy is stored include energy pie charts or energy bar graphs. These qualitative representations can help students create an energy conservation equation for the given scenario. Once the energy conservation equation is found, students can simply substitute the algebraic equations for each energy storage account and solve for the unknown.
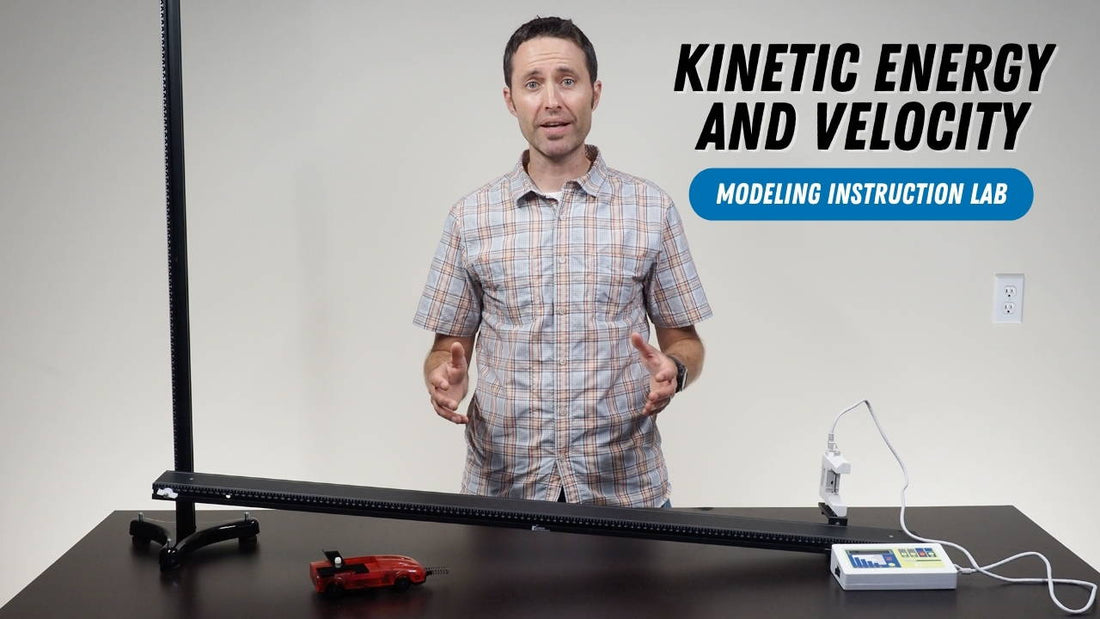
The following article describes an introductory lab for physics or physical science classes that allows students to develop a model for the relationship between an object’s kinetic energy and velocity. This guided investigation will allow students to develop the kinetic energy equation, where the kinetic energy of a moving object is equal to one-half times the object’s mass times the velocity squared or K = 1/2mv2.
Before starting this lab, students need to be familiar with making energy bar graphs and calculating a system’s gravitational potential energy.
The following equipment is needed for each lab group.
- (1) Car and Ramp Lab
- (1) Physics Workshop Stand
- (1) Timer and Photogate
- (1) Meter Stick
- (1) Whiteboard
PRE-LAB DISCUSSION
At the start of the pre-lab discussion, review the basic representational tools and energy equations that have been discussed in class. Just like equations to calculate spring potential energy and gravitational potential energy, tell students they will need an equation that allows them to calculate kinetic energy, the energy stored by moving objects.
For the pre-lab discussion, you can use the “Car and Ramp Lab” equipment and the “Timer and Photogate”. This is the same equipment that can be used by students for data collection.
While pushing the low friction car on a level track, ask students what measurements or variables they think are related to the amount of kinetic energy stored by the moving car. What could be changed about the car that might change its amount of stored kinetic energy? If students already have experience with energy bar graphs, they already understand that faster moving objects store more kinetic energy and vice-versa. They might just need to remind themselves of this fact.
Tell students they are going to do a lab investigation that finds out how an object’s kinetic energy is quantitatively related to its speed or velocity. This will give them an equation that will allow them to calculate the amount of kinetic energy stored by a moving object. Write the following purpose on the board: to determine the relationship between the kinetic energy of a moving object and the object’s velocity.
DATA COLLECTION
Now you can help guide students through a procedure for collecting the needed data. To determine the relationship between the kinetic energy of a moving object and the object’s velocity, the students will need to collect a variety of different velocities and the kinetic energy stored at each measured velocity.
While pushing the low friction car on a level track, ask students how the car’s velocity could be measured. Students will often mention using a motion detector to directly measure the car’s velocity or a meter stick and stopwatch to calculate the car’s velocity. During this discussion, I introduce my students to photogates, which can also be used to measure the car’s velocity. A photogate has the advantage of being able to measure the car’s instantaneous velocity at a specific position. Technically, the photogate is measuring the car’s average velocity over a small displacement while the beam is blocked. This average velocity is very close to the car’s instantaneous velocity as part of the car moves through the photogate. Now that students can easily calculate the car’s velocity, they will need to figure out how they can measure the car’s kinetic energy. Ask students what they could do to transfer a measurable amount of kinetic energy to the car when it moves through the photogate.
Students typically come up with two different scenarios. Scenario one involves using a compressed spring to launch the car on a level track. In this scenario, the car’s final kinetic energy is equal to the initial spring potential energy. If students can calculate the added spring potential energy, they will then know the car’s final kinetic energy. To calculate the initial spring potential energy, the students would first need to experimentally measure the spring constant.
Scenario number two involves elevating one side of the track to make an incline. When the car is raised above the photogate height, students can calculate the amount of gravitational potential energy added to the car and Earth system. Assuming friction is negligible, this initial gravitational potential energy is equal to the car’s kinetic energy when it passes through the photogate. For this article, I will discuss this second scenario.
Remind students that the final kinetic energy is equal to the initial gravitational potential energy, ONLY if the height of the car when moving through the photogate is considered to be a height of zero. This means that when students use the gravitational potential energy equation, they will have to use the car’s change in height from the defined height of zero, rather than just the car’s height from the table’s surface. Also, it is helpful to have students measure the car’s height from the same point each time. Students find it easiest to measure the car’s height using one of the car’s axles.
Just to review, students will use the measured change in height to calculate the initial gravitational potential energy. The car’s kinetic energy when moving through the photogate will be equal to this calculated gravitational potential energy, and the car’s velocity is found using the timer and photogate. In order to collect more kinetic energy and velocity measurements, the students will place the car at different heights along the incline. Make sure that students collect a wide range of values, using the smallest and largest heights possible on the incline.
To introduce some variability in the collected data, instruct half of the lab groups to add 150g to their car for the entire experiment. This variability will help the students reach conclusions about their graphs and equations.
DATA ANALYSIS
To analyze the collected kinetic energy and velocity data, have the students graph their data by placing the kinetic energy values on the y-axis and the velocity values on the x-axis. Students should find that the graphed data will produce a top-opening parabola with a y-intercept close to zero. In order to write the algebraic equation for the relationship between kinetic energy and velocity, the students will first need to “linearize” or “re-express” their nonlinear graph. In my class, this is a skill that was introduced in a previous lab. To hear a more detailed explanation of re-expressing or linearizing a nonlinear relationship, check out my previous video from the Forces and Motion CoolStuff Blog.
Sometimes when students look at their original kinetic energy and velocity graph the trend appears linear. This will typically happen if the students do not collect a wide range of values. Upon closer inspection, there is usually a slight upward curve to the data, but the students are not convinced it is parabolic. When looking at graphical trends, I tell students to look at both the visual pattern of the data AND to think about the expected value of the y-intercept. Ask students what they expect the y-intercept should be. All students will say that they expect the car’s kinetic energy should be zero when its velocity is zero. This means that their graph should have a zero y-intercept. If a data point is placed at the origin, the students will see that the graph is parabolic and will need to be linearized.
To linearize a top-opening parabolic graph, the variable graphed on the x-axis needs to be squared. When students graph the kinetic energy versus velocity squared, their graph will appear linear with a y-intercept close to zero. If necessary, remind students how they can write an equation from their linear graph showing the algebraic relationship between the kinetic energy and the square of the velocity.
Any linear relationship can be written in the form of y = mx+b, but you want your students’ equations to include the specific variables and values from the graph of their specific data. The following steps can be used to guide students in writing their linear equations from their graphed data. When students first learn to write an equation from a linear fit, it is helpful for them to write out each of the three steps.
Step 1: Write the general slope-intercept form of a line: y=mx+b
Step 2: Replace “y” and “x” in the general equation with symbols that represent the variables graphed on each axis. In this lab, the letter “K” is used to represent the kinetic energy, and “v2” is used to represent the velocity squared.
Step 3: Replace “m” and “b” with the numerical values and units of measure for the graph’s slope and y-intercept found using a linear fit of the linearized graph.
Example: The slope of a student’s linear graph is +0.128 J/m2/s2 and the y-intercept is - 0.009J.
Step 1: y = mx+b
Step 2: K = mv2 + b
Step 3: K = (0.128 J/m2/s2)v2 - 0.009J
Encourage students to try and simplify the slope units from their linearized graph. Remind the students that a Joule is equal to a newton times a meter, and that a newton is equal to a kilogram times a meter divided by seconds squared.
Before the students circle up to share the analysis of their results, ask each lab group to discuss the shape of their original graph and the significance or meaning of both the slope and the y-intercept of their linearized graph and equation.
CONCLUSION DISCUSSION
To facilitate a whole-class conversation about the relationship between the kinetic energy of a moving object and the object’s velocity, have each lab group record their original graph, linearized graph, and resulting equation on a large whiteboard. Below is an example of what one lab group’s whiteboard would look like. Students should make sure to label each axis on both graphs and to include the value and units of measure for both the slope and y-intercept in their equation.
Have the class circle up so that everyone can clearly see the graphs and equations on each whiteboard. Remember that your goal is to help facilitate a conversation that allows your students to make connections and draw conclusions from the graphs and equations.
Start by asking students to compare the graphs and equations on the whiteboards and identify any similarities or differences they see. Since lab groups used different mass cars, the students will be able to identify similar graphical shapes and y-intercept values, but different groupings of slope values. The lab groups who used larger mass cars will have higher slope values than the groups who did not add mass to their car. This will be helpful when students discuss the meaning of the slope.
Once the similarities and differences are identified, the rest of the conclusion discussion should focus on the meaning of the slope and the significance of the y-intercept from the linearized graph and equation.
When students look at the values of the y-intercepts, they will have small positive or negative values. The question becomes whether these values are significant or insignificant. To help students judge the significance of a y-intercept, it is not enough to just look at the value. The value of the y-intercept must be compared with the range of values collected on the y-axis, in this case, the kinetic energy values. The threshold is somewhat arbitrary, but I tell my students that the y-intercept is insignificant if it is less than 5% of the maximum y-value.
The y-intercept of the linearized graph can also be considered insignificant if it can be reasoned away. Have the students think about what they would expect the kinetic energy to approach if the value of the velocity squared approached zero. Through a guided conversation, students will be able to identify that the velocity squared value will approach zero as the velocity approaches zero. And as discussed before, all students will say that they expect the car’s kinetic energy should be zero when its velocity is zero. Since the y-intercept can be reasoned away, it can be left out of the algebraic equation.
When students look at the slope of the linearized graphs and equations, they should find two groupings of values. Also, if students simplified the slope units, they should find that the slope units are just kilograms. Ask students why there are two groupings of slope values. If students can determine the cause of different slope values, this will help them determine the meaning of the slope. The slope of any linear relationship represents the change in the y-variable for each unit of change in the x-variable. For this lab that would be the increase in the car’s kinetic energy for one unit of increase in velocity squared. This may be a true statement, but it’s not the meaning of the slope you want students to have. It turns out that the slope represents half of the car’s mass, but how do you guide students to that conclusion?
Start by reminding students that the slopes of their linearized graphs are constant. This is true for any linear relationship. So this means that the slope must represent something that stayed constant during each trial in their experiment. This constant thing must also explain why groups got different slope values. Discuss each shared idea to help students decide if this is the meaning of the slope. If students simplified the slope units, they should find that the slope only has units of kilograms. This suggests that the values represent a constant mass.
When students compare their slope value to the car’s mass used in the experiment, they should find that the slope is not equal to the car’s mass. The slope value is approximately equal to one-half of the car’s mass.
After students reach a consensus about the meaning of the slope and the significance of the y-intercept, you can write the general equation on the board. The general equation shows the relationship between an object’s kinetic energy and velocity. An object’s kinetic energy is equal to one-half of its mass multiplied by its velocity squared. With this equation for the kinetic energy of any translating object, students now have all the quantitative tools they need to complete introductory energy conservation problems.
To hear a more detailed explanation about the energy bar graphs used in this video, see the following links posted on my YouTube page “Debbink Physics”. The videos discuss how to make energy bar graphs when the “system” is defined differently and when friction is considered.
Energy Bar Graphs (Part 1: Energy Conservation) + Example Problems
Energy Bar Graphs (Part 2: Work = Energy Transfer) + Example Problems
If you are interested in learning more about these types of guided inquiry labs used in the modeling method of instruction visit www.modelinginstruction.org.
Happy investigating!
Aaron Debbink
Featured Products
Aaron Debbink
Physics Instructor
Indian Hill High School
Cincinnati, OH
Aaron Debbink is a physics teacher with 16 years of classroom experience who has an undergraduate engineering degree and a masters degree in physics. He is passionate about building a classroom culture that values exploration and a drive for understanding. Aaron uses Modeling Instruction in his introductory and AP physics classes and has been a Modeling Instruction workshop leader since 2011. Aaron is a Knowles Teaching Fellow and the recipient of a 2019 Yale Educator Award.


